March 8, 2023 · 6 min read ·
(Originally posted on the Google Cloud Blog here)
The New Way of Log Analytics
Logging is a critical component of any cloud environment, but it can be challenging to manage all the data generated by your applications and infrastructure. Fortunately, Google Cloud offers an built-in logging platform that allows you to aggregate your logs, and stream them to BigQuery, Pub/Sub or storage.
The usual way to enable analytics on your Google Cloud logs is to sink the logs from different GCP sources to BigQuery. It’s a feature natively available in Google Cloud logging, and all you need to do is to create a dataset, point a logging sink to it and give the logging sink service account roles/bigquery.dataEditor on the dataset.
I was about to open a PR with my terraform (a simplified version of this module since I don’t need VPC SC compatibility) when I saw this:
Log Analytics in cloud logging is now GA
Log Analytics? What is Log Analytics?
According to the article:
[Log Analytics is] a capability that allows you to search, aggregate and transform all log data types including application, network and audit log data
And it’s powered by BigQuery! Does this mean.. what I think it means? Yes!
You can set up centralised logging in Google Cloud, with the analytical power of BigQuery, without copying the data into BigQuery!
Now, for me, the aggregate part of that statement above is of particular interest. Aggregation for logs means streaming them from all different sources in your systems into a single location, with the ability to apply filters, exclusions, redactions etc. I want to aggregate logs from the organization, as well as from specific folders, into one location.
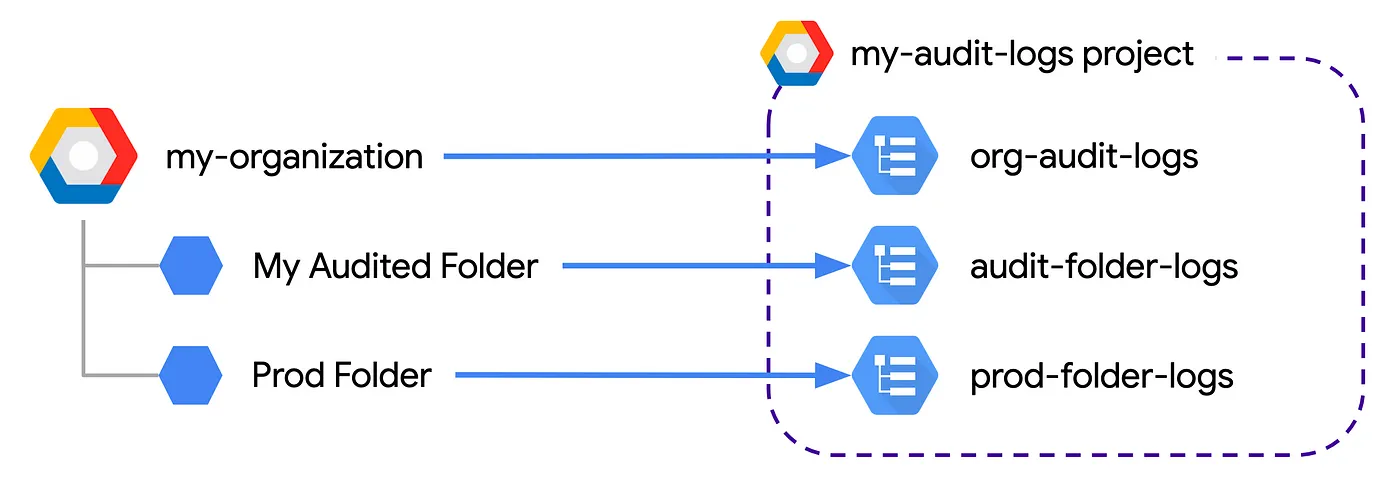
Diagram of aggregated logging in Google Cloud, with logs from the organization ‘my-organization’ and 2 folders, ‘My Audited Folder’ and ‘Prod Folder’ sinked into logging buckets in the ‘my-audit-logs’ project
So How Do I Set This Up?
-
Create the log bucket where you will stream your logs
-
Terraform the logging sink(s)
-
Enjoy!
Create a Logging Bucket and Enable Log Analytics
The first step needs to be done manually (for now):
Creating a new logging bucket in the Google Cloud console, with Log Analytics enabled and a BigQuery dataset linked to the bucket. The bucket will contain aggregated logs from the prod folder
In the Console
-
Select the project where you want to store the logs
-
Go to
Logging->Log Storage->Create Log Bucket -
Give the bucket a meaningful name
-
Click
Upgrade to Log Analyticsand, optionally,Create a new BigQuery dataset(this does not affect the analytics functionality) -
Select the region: currently
global,us,eu,us-central1,us-west1, andasia-south1are available -
Click Next
-
Enter the log retention period in days
-
Click Create Bucket
Using GCloud
# Create new logging bucket with analytics enabled

gcloud logging buckets create audit-folder-logs --location=global \
 --enable-analytics \
 --retention-days=90 \
 --project=my-audit-logs

# Optional - link a BigQuery dataset

gcloud logging links create audit_folder_logs --bucket audit-folder-logs \
 --location=global \
 --project=my-audit-logs
If you’re anything like me, having to do this manually feels really uncomfortable. Luckily, it is temporary — terraform implementation is on the way :)
Set up a Logging Sink (or Sinks)
Setting up the logging sink itself requires the following pieces of terraform:
-
The sink itself:
google_logging_folder_sink,google_logging_organization_sinkorgoogle_logging_project_sink -
IAM permissions for the sink identity to write logs to the destination
Here is an example for a folder-level sink. This creates a sink for My Audited Folder folder, which is a top-level folder inside the GCP org.
# Find the folder number that you want to sink logs from

data "google_active_folder" "audited_folder" {
display_name = "My Audited Folder"
parent = data.google_organization.org.name
}

# Creare a logging sink for the folder

resource "google_logging_folder_sink" "audited_folder" {
name = "audited-folder-logs"
description = "Sink for My Audited Folder, including all children"
folder = data.google_active_folder.audited_folder.name
destination = "logging.googleapis.com/projects/my-audit-logs/locations/global/buckets/audit-folder-logs"
include_children = true

filter = "protoPayload.@type = type.googleapis.com/google.cloud.audit.AuditLog"
}

# Allow each sink's service account to write logs into the audit logs project

resource "google_project_iam_member" "folder-log-writer" {
project = "my-audit-logs"
role = "roles/logging.bucketWriter"
member = google_logging_folder_sink.audited_folder.writer_identity
}
What to do with Your Logs
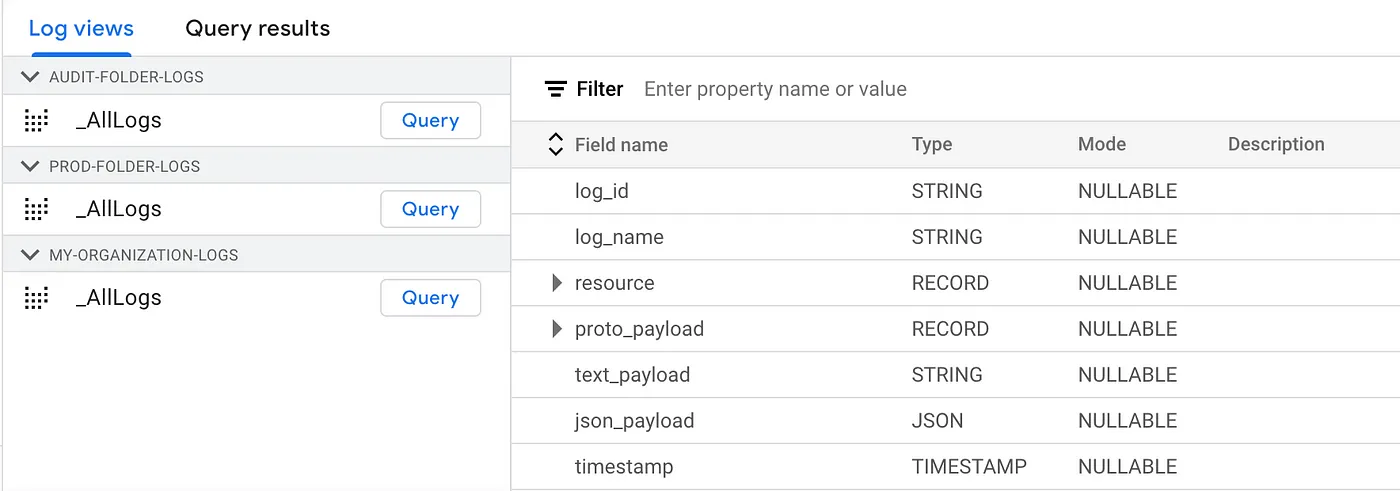
Once the logs are sinked to the designated logging buckets, their view is available in Log Analytics, complete with BigQuery-like schemas
Now that your logs are all nicely streamed into a central place, there are a few things you can do with them:
- Organization-wide log-based security alerts
One of the coolest things you can do with your centralised logs in GCP is setting up log-based alerts. For example, you might want to alert when a folder- or organization-wide IAM role is assigned to a service account.
To create such alert in Terraform, use the following:
# Create a log-based metric that sniffs the folder logging bucket
resource "google_logging_metric" "folder_iam_changes_for_serviceaccounts" {
  project     = "my-audit-logs"
  name        = "folder_iam_changes_for_serviceaccounts"
  bucket_name = "projects/my-audit-logs/locations/global/buckets/audit-folder-logs"
  filter      = "protoPayload.methodName=\"SetIamPolicy\" protoPayload.resourceName=~\"folders/\" protoPayload.serviceData.policyDelta.bindingDeltas.action=\"ADD\" protoPayload.serviceData.policyDelta.bindingDeltas.member=~\"serviceAccount\""
  description = "Find when afolder-level IAM role is assigned to a service account"
  metric_descriptor {
    metric_kind = "DELTA"
    value_type  = "INT64"
  }
}

# Set up a policy to alert every time a folder-level IAM role is assigned to a service account
resource "google_monitoring_alert_policy" "org_iam_changes_for_serviceaccounts" {
  project      = "my-audit-logs"
  display_name = "Alert when a folder-level IAM role is assigned to a service account"
  combiner     = "OR"
  conditions {
    display_name = "folder-level IAM role assigned to SA"
    condition_threshold {
      filter          = "metric.type=\"logging.googleapis.com/user/folder_iam_changes_for_serviceaccounts\""
      duration        = "0s"
      comparison      = "COMPARISON_GT"
      threshold_value = "0"
    }
  }
- Easier debugging and/or event tracing
If you’ve ever run data transformation jobs on Composer with data distributed across different GCP project and VPC SC perimeters, you’ll know how tricky it is to find where the access error occurs. Now, you can search throughout all your logs — with logging queries or SQL. Nice.
- Resource usage and cost analytics
This is not new — people have been building BigQuery cost dashboards based on the totalQueriedBytes and totalBilledBytes fields in BQ access logs for years. Now, however, you don’t need to sink those logs to BQ in order to get access to such analytics.
Limitations
As mentioned in the setup steps, there are currently a few limitations to GCP Log Analytics. Firstly, you have to perform a manual operation in order to upgrate a log bucket to use Log Analytics (or to create a new one with Log Analytics enabled). Other restrictions include the available regions (global, us, eu, us-central1, us-west1, and asia-south1 are supported at the time of writing). These limitations are there for now, but the team is working on improvements.